Coredump
Typically, a core file (core dump file) contains the program's memory, register states, stack pointers, memory management information, and various function call stack information at the time of the crash. We can understand it as a file that stores the current state of the program. Many programs generate a core file when they crash. By analyzing this file with tools, we can locate the stack calls corresponding to the program's abnormal exit, identify the problem, and resolve it promptly.
Collecting with apport
Starting from Bianbu 2.0rc1, apport is pre-installed to collect crash information.
Introduction
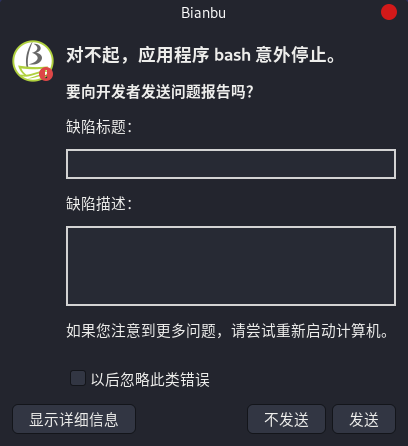
apport is an error collection system that collects software crashes and unhandled exceptions and generates crash reports. When an application crashes or encounters a bug, apport will alert the user with a popup and ask if they want to submit a crash report. Once a program crashes, a .crash file is generated, recording the crash information and saved in the /var/crash directory. Only the first crash of the same program is saved; you can delete it during debugging.
Debugging
First, extract the Coredump from the crash report to a specified directory,
apport-unpack /var/crash/_usr_bin_bash.0.crash /tmp/crash
Debug with gdb,
gdb /usr/bin/bash /tmp/crash/CoreDump
To view the complete symbol table, you need to install the related dbg package (e.g., bash-dbgsym) in advance.
Uploading Crash Reports
If you encounter a crash that you cannot resolve on your own, you can choose to upload the crash report to the ticket system, and we will assist you in resolving it.
Prerequisites
Configure the ticket system's api key in the ~/.config/apport/redmine.credentials file.
Upload
When a crash occurs, a popup will appear. Fill in the relevant information as prompted and click Send to automatically upload the crash report and open the browser to the newly uploaded crash report.

You can also choose not to send it temporarily and use the following command to redisplay the popup later.
touch /var/crash/_usr_bin_bash.0.crash
Viewing Uploaded Crash Reports
You can visit 时空服务 to view them, and we will also respond to your questions there.
Without apport
If you want the kernel to generate core files directly without using apport, you can refer to the following content.
Enabling coredump
By default, the system disables coredump. You can check it with ulimit -c,
ulimit -c
0
A value of 0 means no core dump file is generated. To enable coredump, you need to set the core file size and path.
Setting Core File Size
Set the core file size to unlimited with the command ulimit -c unlimited, or set it according to your needs.
ulimit -c unlimited
This command is only effective for the current terminal. To set it at system startup, you can edit the /etc/security/limits.conf file and add the following two lines:
* soft core unlimited
* hard core unlimited
Setting Core File Path
Set the core file path and name,
echo /var/crash/core-%e-%p-%t | sudo tee /proc/sys/kernel/core_pattern
This command is only effective for the current terminal. To set it at system startup, you can edit the /etc/sysctl.conf file and add the following line:
kernel.core_pattern = /var/crash/core-%e-%p-%t
Run sudo sysctl -p to apply the configuration.
Testing
Run the following command to test if it is effective,
bash -c 'kill -SEGV $$'
If effective, you will see the following output,
[1] PID segmentation fault (core dumped) bash -c 'kill -SEGV $$'
Where PID is the current process ID of bash. At the same time, a corresponding core file will be generated in the /var/crash directory.