7.3 Netdata Tutorial
Latest Version: 2025/09/22
Overview
Netdata is a real-time performance monitoring and visualization tool that tracks both system-level and application-level metrics.
Key features:
- Real-time monitoring: Refreshes system and application metrics every second
- Rich visualizations: Provides web dashboards, charts, and alerts
- Lightweight: Low overhead with minimal impact on production systems
- Multi-platform support: Linux, BSD, Docker, and more
Typical use cases:
- Monitoring system resources (CPU, memory, disk, network)
- Analyzing service performance (web servers, databases, etc.)
- Detecting anomalies and setting alerts
Official documentation: https://learn.netdata.cloud
Netdata Installation
sudo apt update
sudo apt install netdata
Starting and Accessing Netdata
Start the Service
sudo systemctl start netdata
sudo systemctl enable netdata
Stop and Restart
sudo systemctl stop netdata
sudo systemctl restart netdata
Access the Web Interface
Local Access
Netdata listens on port 19999 by default. After installation, access it via your browser at:
http://localhost:19999/
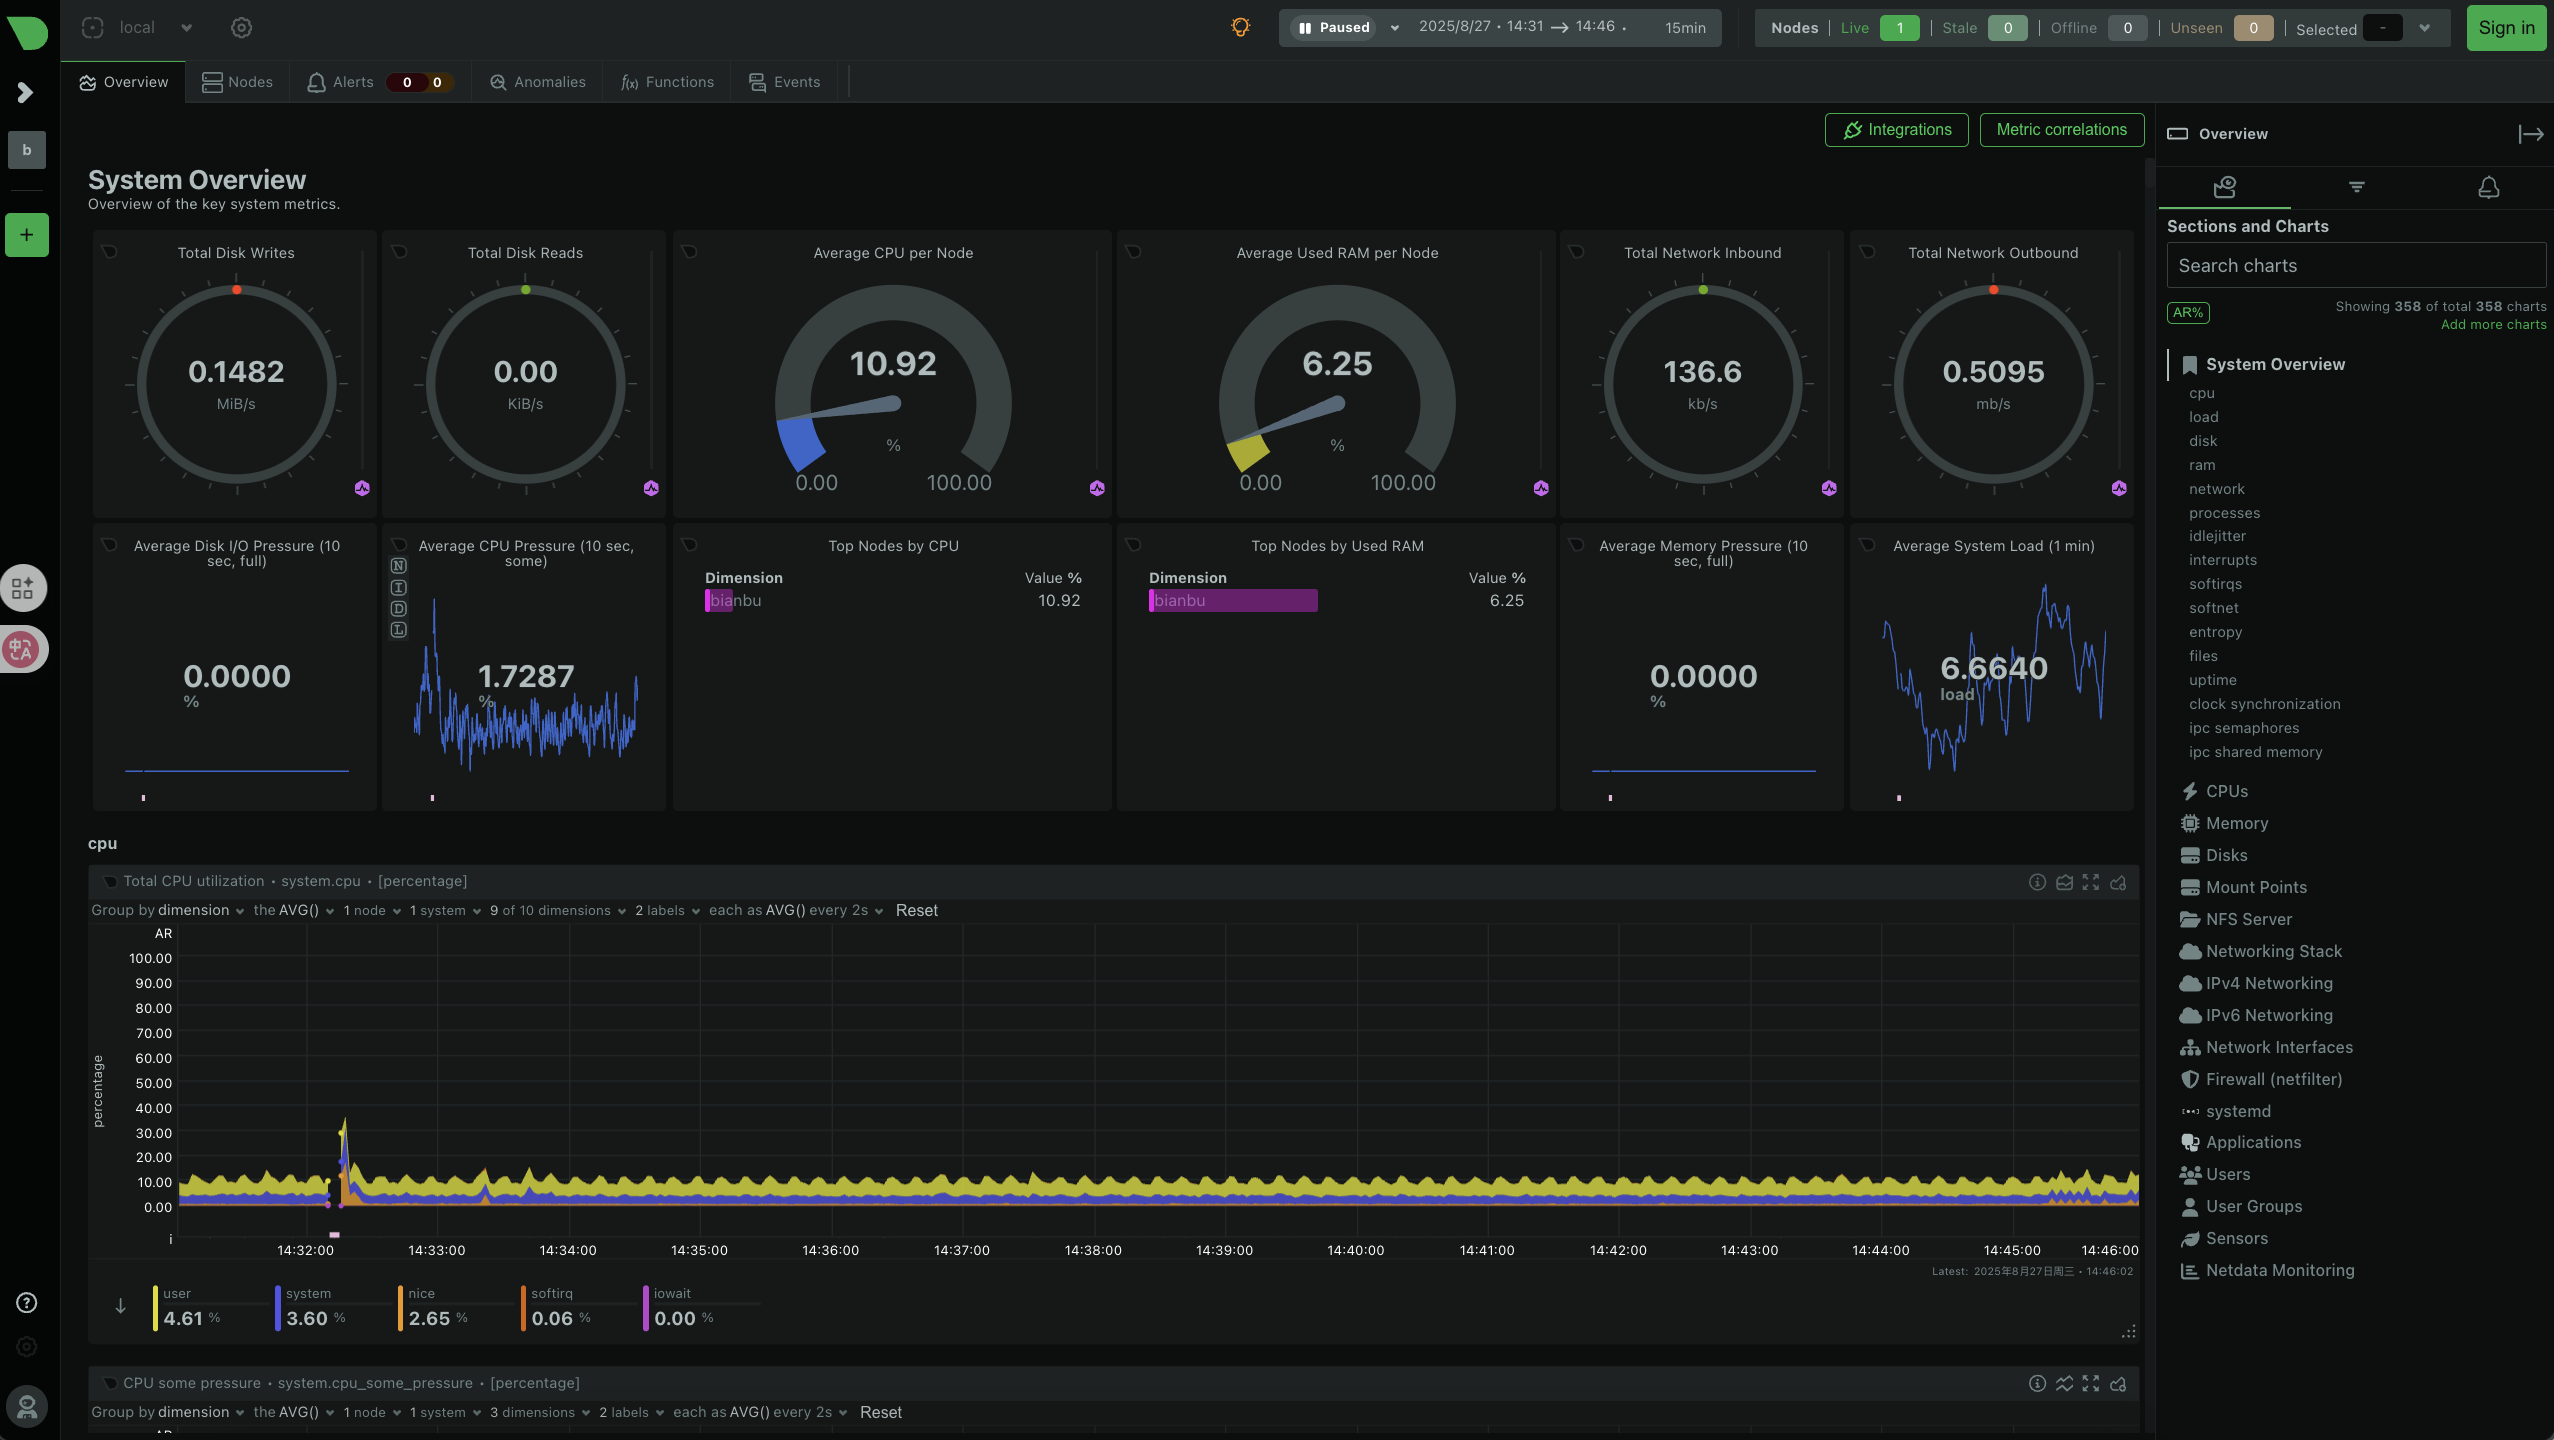
The web interface displays real-time metrics for CPU, memory, disk, network, processes, etc.
LAN Access
To allow other machines on your local network to access Netdata, modify the configuration file:
sudo vim /etc/netdata/netdata.conf
Locate the configuration line:
bind socket to IP = 127.0.0.1
Change it to:
bind socket to IP = 0.0.0.0
Restart the service for changes to take effect:
sudo systemctl restart netdata
Access Netdata from other machines using http://<server-IP>:19999/.
Key Monitoring Metrics
By default, Netdata automatically tracks:
| Category | Example Metrics |
|---|---|
| CPU | Usage, load, frequency, context switches |
| Memory | Usage, cache, swap space |
| Disk | I/O read/write rates, latency, disk queues |
| Network | Bandwidth, traffic, packet loss |
| System | Process count, file handles, user login info |
| Services | Web servers, databases, containers (requires plugins) |
Process Monitoring
The web interface shows CPU, memory, and thread counts for each process, with sorting and filtering options.
Application monitoring (via plugins)
Plugins extend Netdata to track applications like:
- Nginx / Apache
- MySQL / PostgreSQL
- Docker / Kubernetes
Once installed, these metrics appear automatically the web interface.
Netdata Configuration
Configuration File Location
Netdata's main configuration file is located at:
/etc/netdata/netdata.conf
Common configuration options:
bind socket to IP = 127.0.0.1Indicates the target monitoring address for the Web interface- Default
127.0.0.1: Local access only - Change to
0.0.0.0: Allow access from any LAN IP
- Default
run as user = netdataSpecifies the user account that runs the Netdata service (default:netdata). It operates with minimal privileges to improve security.web files owner = rootSets ownership of web interface files (typicallyroot) to prevent unauthorized modificationsweb files group = rootSpecifies the group for web interface files (default:root), used together withowner.
Restart the service after configuration changes:
sudo systemctl restart netdata
Configuration Alert
Alert configuration files are located in:
/etc/netdata/health.d/
Example custom threshold:
alarm: high_cpu
on: system.cpu
calc: $usage > 90
every: 10s
warn: $usage > 80
info: CPU usage exceeds threshold
Triggers alerts when CPU usage exceeds 90%, with notifications via email or Slack.
Advanced Features
Multi-node Monitoring
- Supports Master/Child mode
- Master node collects data from multiple child nodes for centralized management
Data Export
- Works with Prometheus, Graphite, and other data collectors
- Access historical data and create custom reports via API